How the UXO heatmap works.
The methodology behind the indicative historical UXO layer in Frontline Atlas: which records go in, how they are weighted, what the grid is, what you can export — and what it cannot tell you.
The atlas is opening to the public — sign-up is free.
// why it exists
A first look before the desk study.
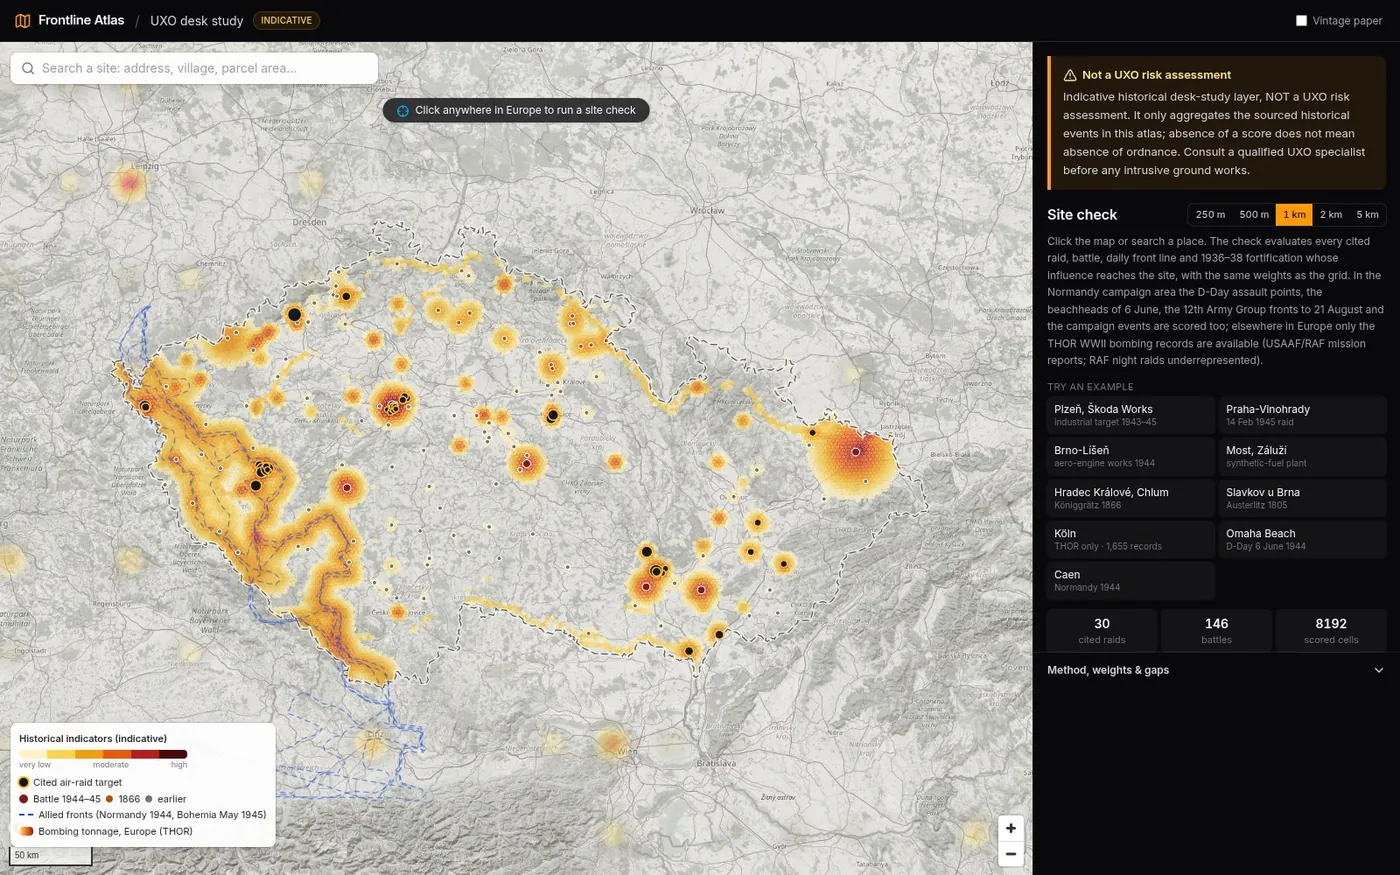
Before anyone digs in a place that saw the Second World War, the usual first step is a desk study: what happened here, and how much of it involved explosive ordnance? Answering that means pulling together bombing records, battles, front lines and fortifications from a dozen places. Frontline Atlas already had most of those layers, cited, on one map.
So the UXO layer answers one narrow question: how much documented military activity with explosive ordnance happened near this place, according to the sources in this atlas? Every contribution to a score comes from a specific, cited event. Nothing is modelled beyond that — no soil, no clearance history, no finds reports. It is a pre-screening aid, not an answer.
// inputs
Five kinds of cited indicator.
| indicator | in the current build | source |
|---|---|---|
| THOR bombing records | 80,275 cleaned records, 2.56 Mt; 398 aggregated target positions in the gridded areas | THOR — Theater History of Operations Reports, WWII (US Air Force Research Institute / data.mil, public domain) |
| Cited air raids | 30 raids on Czech territory, 17 Apr 1943 – 25 Apr 1945 (25 USAAF, 4 RAF, 1 Soviet), 51 named aim points | Czech Wikipedia articles, Klub přátel Pardubicka, iDNES (with VHÚ historians), vets.cz, ČT24; aim points are Wikidata items |
| Battles | 146 points: 124 Wikidata battles in the Czech lands plus the cited Normandy 1944 assault points and campaign events | Wikidata (coordinate, date) with Wikipedia links; the atlas's own cited Normandy layers |
| Front lines | 31 dated lines: US 12th Army Group, each day 4–9 May 1945 in Czechia; D-Day beachheads and 12th Army Group fronts, 13 June – 21 August 1944, in Normandy | HQ 12th Army Group situation maps (Library of Congress); U.S. Army CMH maps |
| 1936–38 fortifications | 5,960 pillboxes, blockhouses, observation posts and shelters | OpenStreetMap (ODbL) |
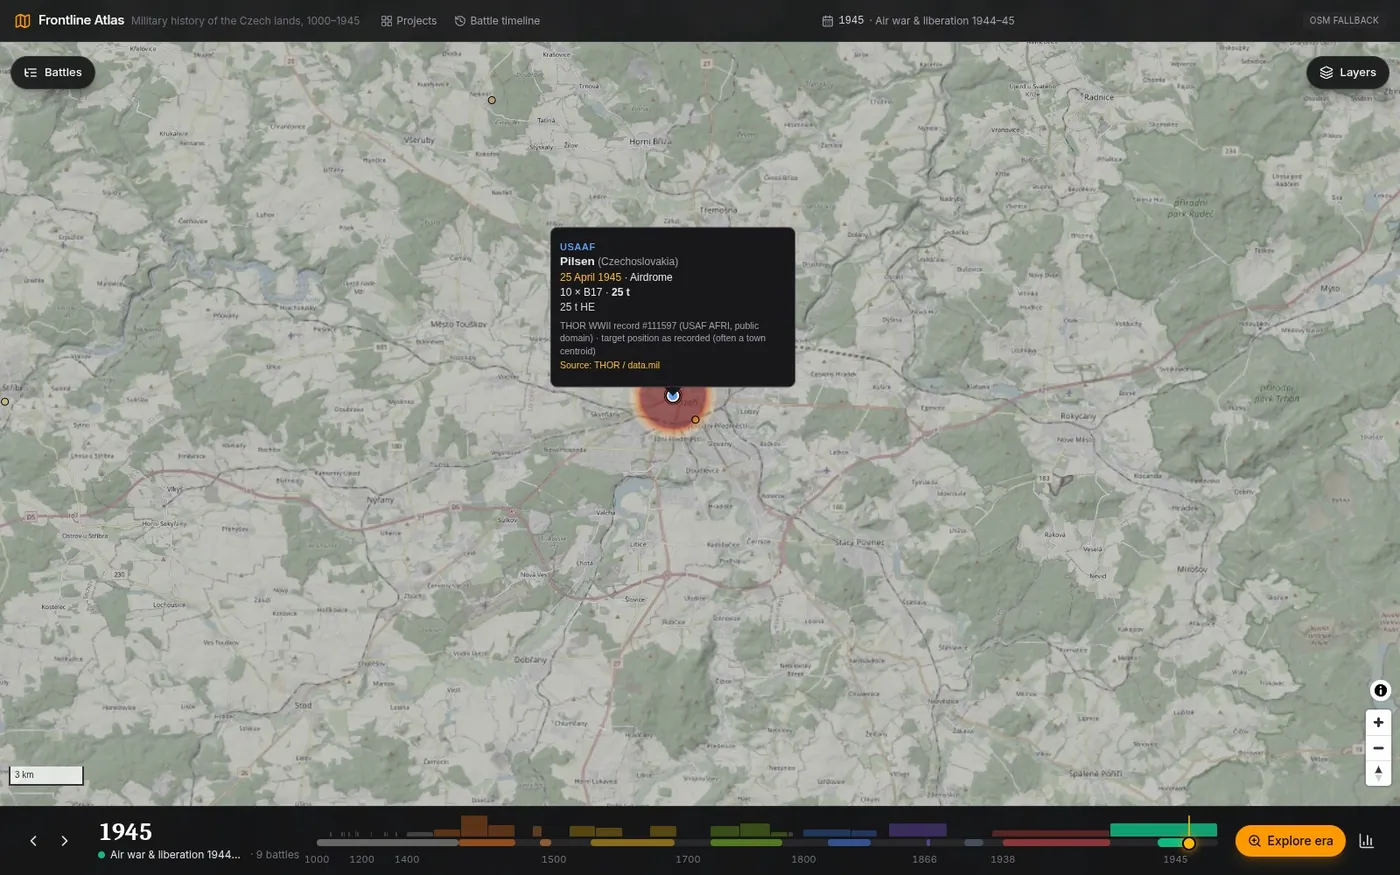
THOR, cleaned. The raw export has 126,697 rows for the European and Mediterranean theatres. 42,065 rows identical in every field except the row id are treated as duplicates and dropped. 6,459 rows with missing, zero or out-of-theatre coordinates and 374 with unusable dates are flagged and not plotted. A single record claiming more than 2,000 t is treated as unknown tonnage. What's left: 80,275 records, 2,563,471 t (53,386 USAAF records, 26,865 RAF). Nothing is guessed; bad rows are flagged, not fixed.
Raid coordinates are checked automatically. Every cited aim point is a Wikidata item. The build fetches the item's coordinate and fails if the stored point is more than 1.5 km away. Raid intensity comes only from figures stated in the source — bombers, tonnage, bomb counts: heavy 1.0, medium 0.6, light 0.3, jettison 0.25.
// the kernel
Weight, radius, and a Gaussian falloff.
Every input has a weight w and a radius r. It contributes to each cell centre (or site point) at distance d:
contribution = w × exp(-(d / r)²)

  evaluated up to d = 2.5 r, ignored below 0.0001
  at d = r   → 37 % of w
  at d = 2 r → under 2 % of w

cell score = sum of contributions (after caps, below)
Battles are weighted by the ordnance technology of their era, so a Hussite battlefield and a 1945 one don't look alike:
| battles, by era | w | r (km) |
|---|---|---|
| Medieval | 0.01 | 3 |
| Hussite Wars · Bohemian–Hungarian War | 0.02 | 3 |
| Thirty Years' War | 0.03 | 3 |
| Silesian & Seven Years' wars | 0.04 | 4 |
| Napoleonic (1805) | 0.05 | 4 |
| 1866 Austro-Prussian War | 0.25 | 5 |
| WW1 (no fighting on Czech territory) | 0 | – |
| 1938–39 clashes | 0.05 | 2 |
| 1944–45 | 1.0 | 6 |
| Normandy, D-Day 6 June 1944 | 1.0 | 4 |
| Normandy campaign, June–Aug 1944 | 1.0 | 6 |
A handful of battles get overrides — the Moravia–Ostrava offensive (w 1.0, r 14 km, a multi-week operation), the Prague Uprising (1.0, 7 km), the 1944 air battle over the Ore Mountains (0.4, 10 km) — each with its reason written next to the number.
| other inputs | w | r (km) |
|---|---|---|
| Cited air raid, per aim point | 1.0 × intensity × share | 2.5 point · 3 industrial / rail / airfield / area · 4.5 city |
| THOR target position | 1.0 × min(1, log10(1+t) / log10(1+2000)) | 3 |
| Front line, Czech lands, per day | 0.12 | 5 |
| Front line, Normandy, per sheet | 0.3 | 5 |
| 1936–38 fortification, each | 0.015 | 1 |
THOR records are grouped by target position (rounded to 0.001°) and weighted by the logarithm of cumulative tonnage t: 2,000 t at one position reaches the full weight, so heavily bombed places score higher without a single huge target swamping the map.
// caps and double counting
The same bombs are never counted twice.
- Raids vs THOR. Cited raids and THOR records often describe the same bombs. Per cell the air component is the larger of the cited-raid sum and the THOR sum capped at 1.0. The other is dropped; they are never added.
- Front cap. Summed front-line contributions in one cell are capped at 0.6 (scaled down proportionally), so the daily lines of one front don't pile up without limit.
- Fortifications. Summed per cell and capped at 0.1. Most were never fought over.
// the grid
H3 hexagons, resolution 7.
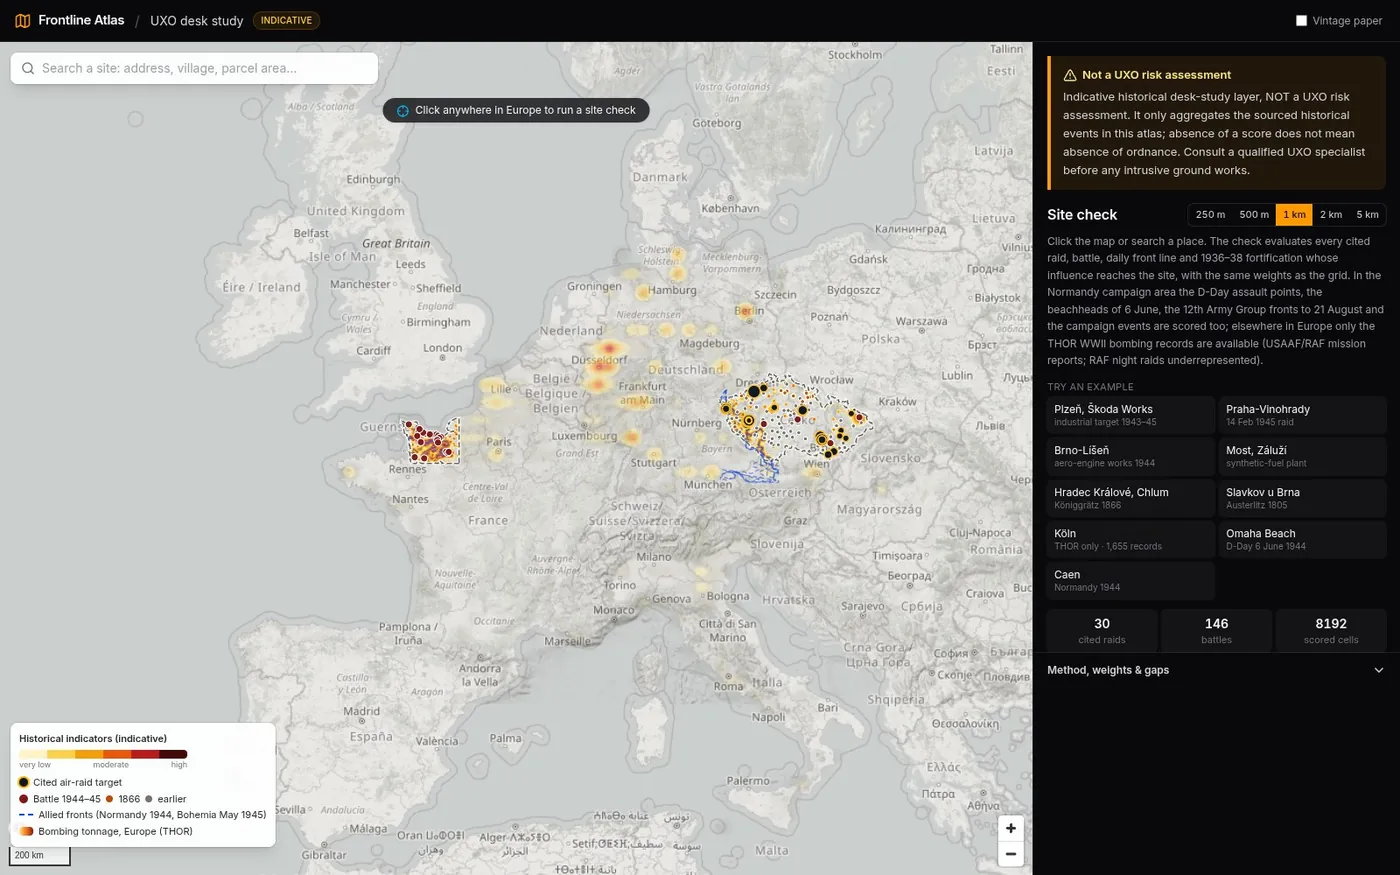
The heat grid uses Uber's H3 hexagons at resolution 7: about 5.2 km² per cell, centres roughly 2.4 km apart. It covers Czechia (15,962 cells) and the Normandy campaign area (3,749 cells) — 19,711 in total. The sea is not gridded. Cells scoring below 0.015 aren't drawn; 8,192 carry a score.
| class | score ≥ | cells |
|---|---|---|
| very low | 0.015 | 2,380 |
| low | 0.08 | 2,562 |
| moderate | 0.25 | 2,046 |
| elevated | 0.6 | 915 |
| high (historical indicators) | 1.2 | 289 |
The highest cell scores 3.6. Classes are relative bands of documented activity — not probabilities of finding ordnance.
// site check and exports
Click a place, get a desk-study summary.
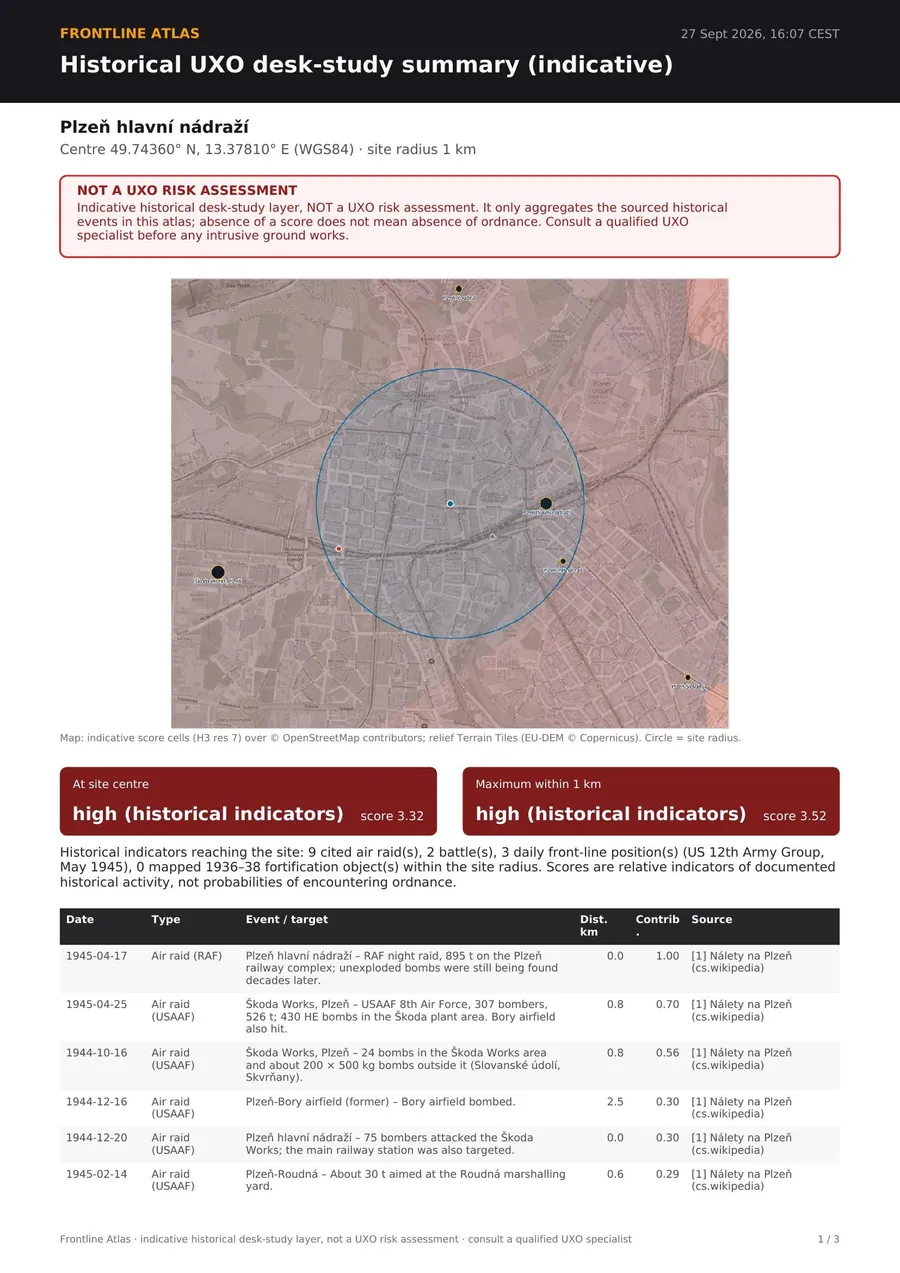
Click the map or search an address and pick a radius from 250 m to 5 km. The site check runs the same kernel in the browser on the cited inputs, so it isn't limited by the 2.4 km grid:
- It loads the THOR records within the radius plus 7.5 km, so it works anywhere in Europe (outside Czechia and Normandy only THOR is available).
- It scores the centre and a 13 × 13 sample grid inside the radius, and reports the centre and the maximum with their classes.
- It lists every input whose influence reaches the site — distance, contribution, weight, radius, rationale and source link.
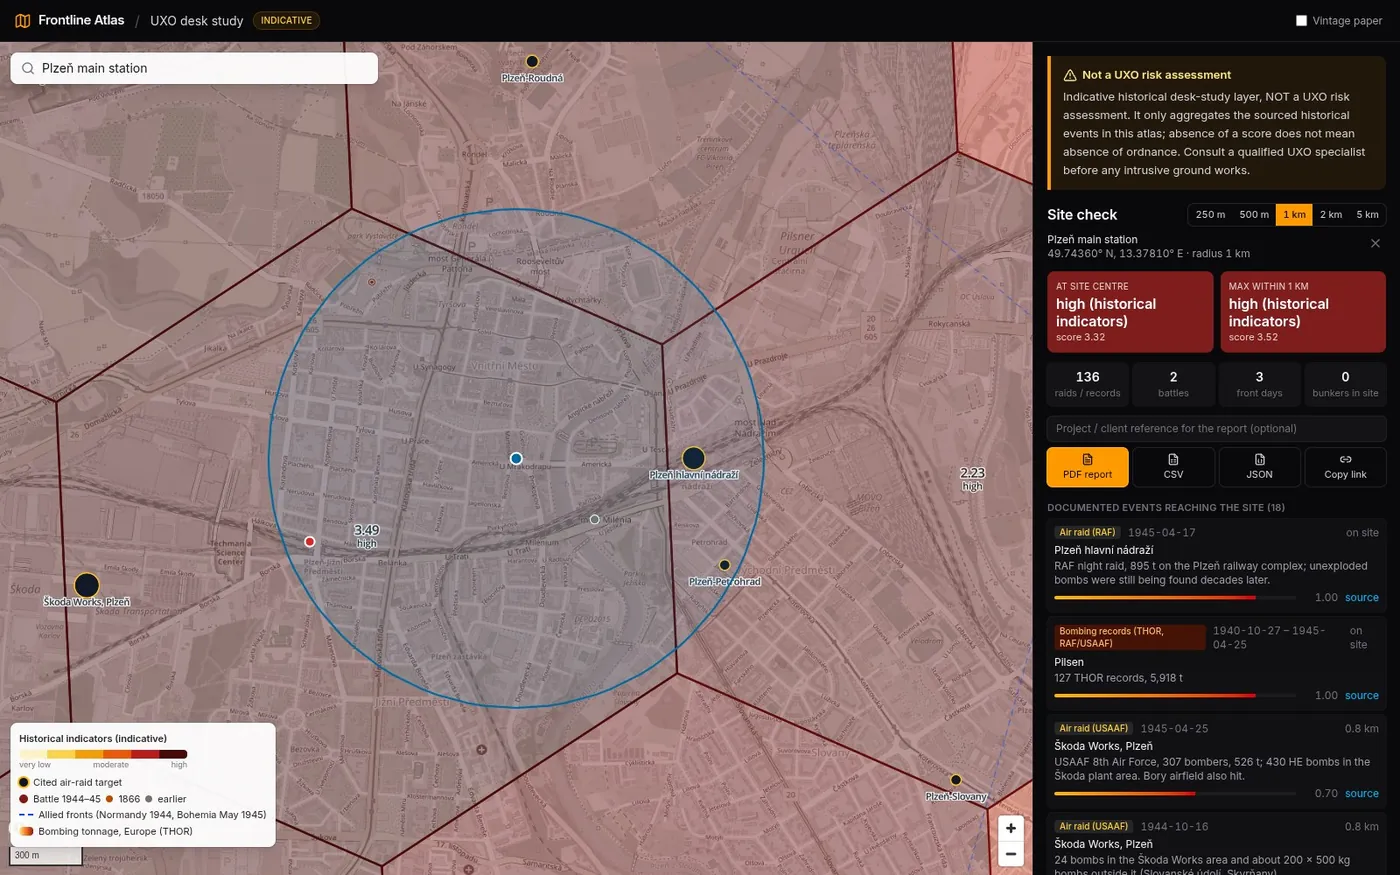
The result exports three ways: a PDF desk-study summary (map, event table, method and weights, known gaps, numbered sources, and the disclaimer on every page), plus CSV and JSON for anyone who wants the raw event list.
// known gaps
What it doesn't know.
These are listed in the atlas UI and in every PDF, not just here.
- RAF night raids. RAF Bomber Command night raids are under-represented in THOR — many are missing or aggregated.
- Coordinates. THOR target positions are often a town centroid, not the aim point, and some are wrong. Missing, zero or out-of-theatre coordinates are dropped, not guessed.
- Coverage. Only Czechia and the Normandy campaign area are gridded. Elsewhere the site check has THOR only. In Normandy the sea isn't gridded, so offshore and beach-obstacle ordnance isn't scored, and the dense 1944 minefields and artillery positions aren't individually mapped.
- Not mapped at all. Ammunition dumps, depots and post-war disposal sites; military training areas; WW1 munition factories; Cold War sites; individual aircraft crash sites; the 1944 Ostrava and Bohumín refinery raids (not yet sourced to a citable document).
- Battles are points. One Wikidata point per battle, not a battlefield outline; some points are representative only and flagged approximate.
- Weights are judgement. They come from the ordnance technology of each period and are published in full, but they are not calibrated against finds statistics.
// read this before using it
Try it at atlas.davidbroza.dev/uxo — the atlas is opening to the public, and sign-up is free. The rest of the project (period maps, the battle timeline, Austerlitz hour by hour) is on the Frontline Atlas project page →
Note: this article was written by an AI from my brief and the atlas's methodology notes. The method and every number in it come from the running code — the prose isn't hand-written.