// project · terraforge
TerraForge
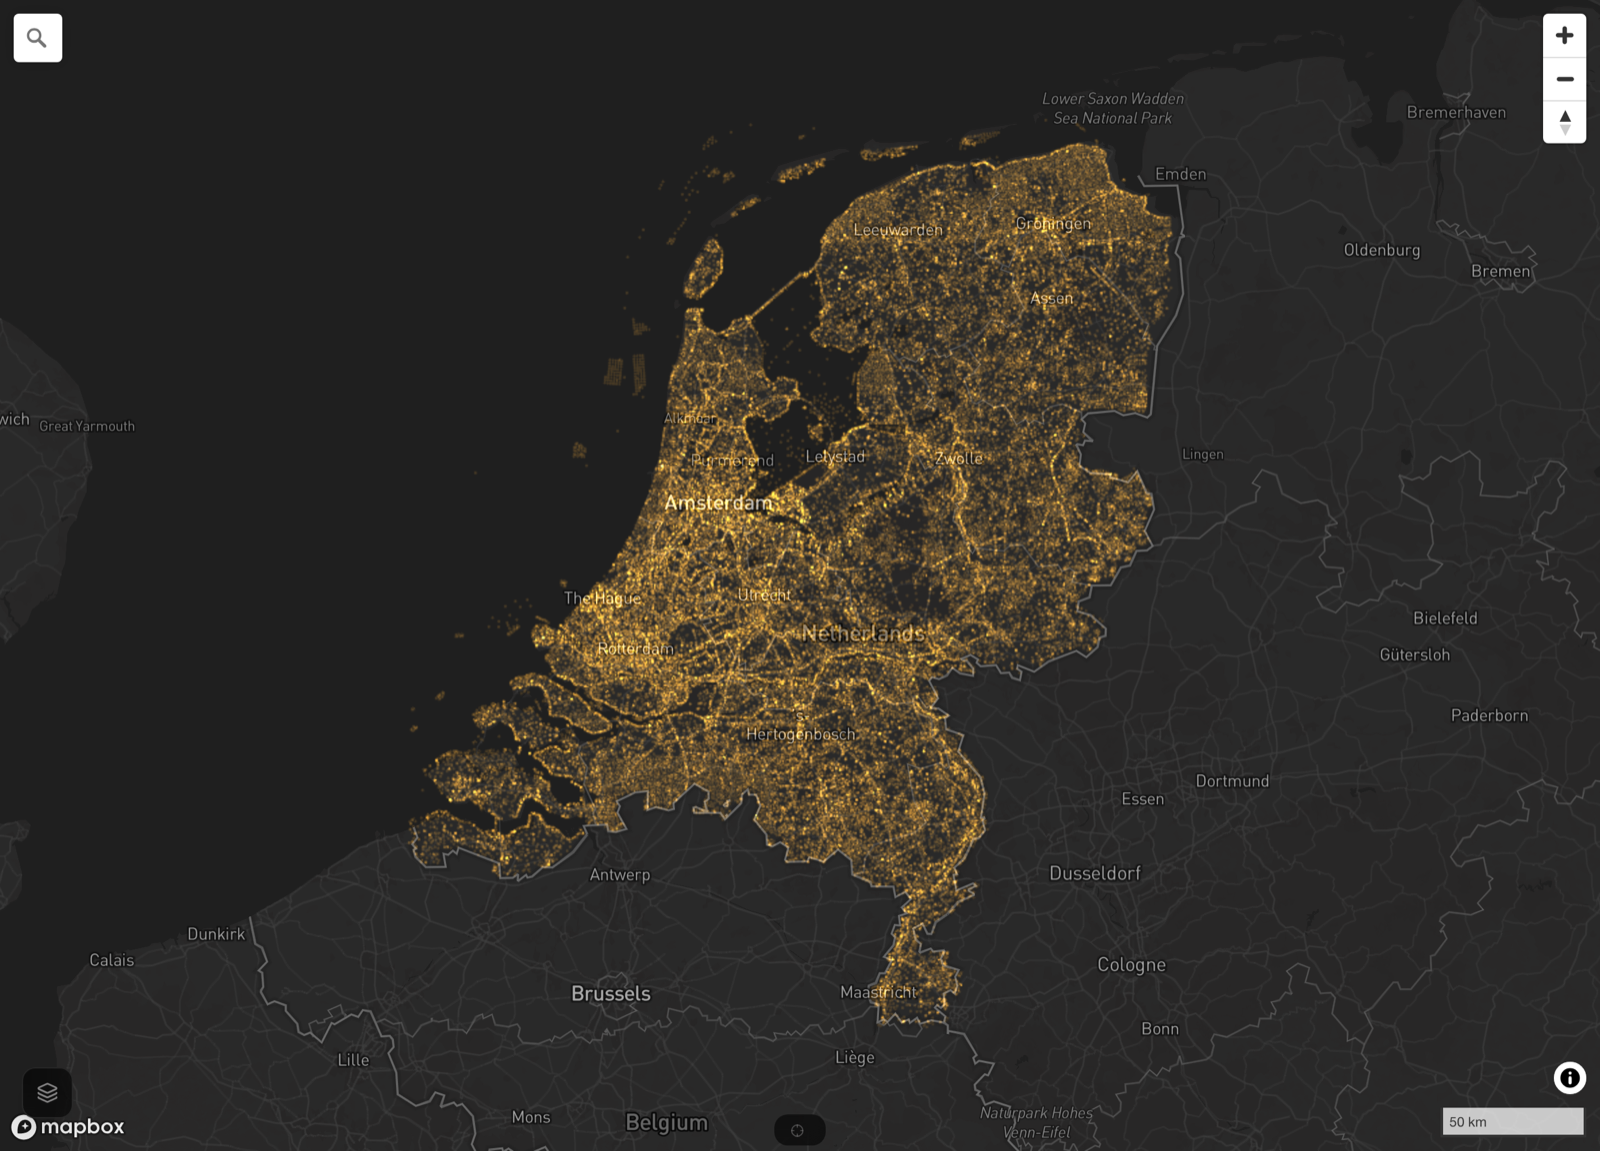
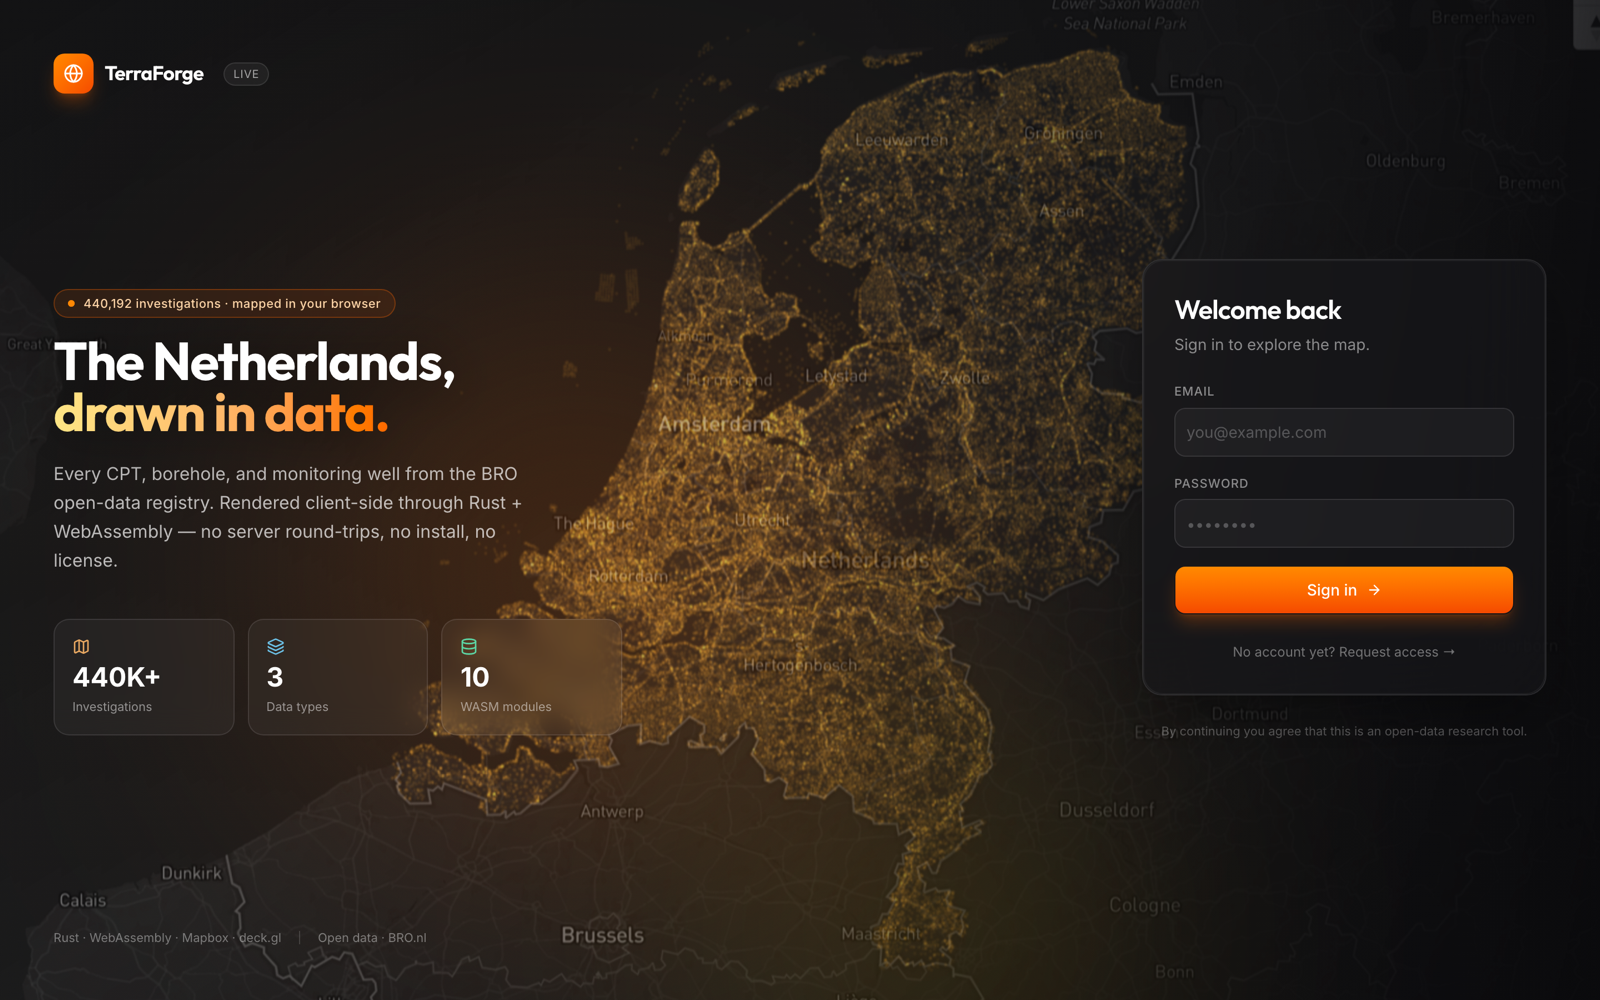
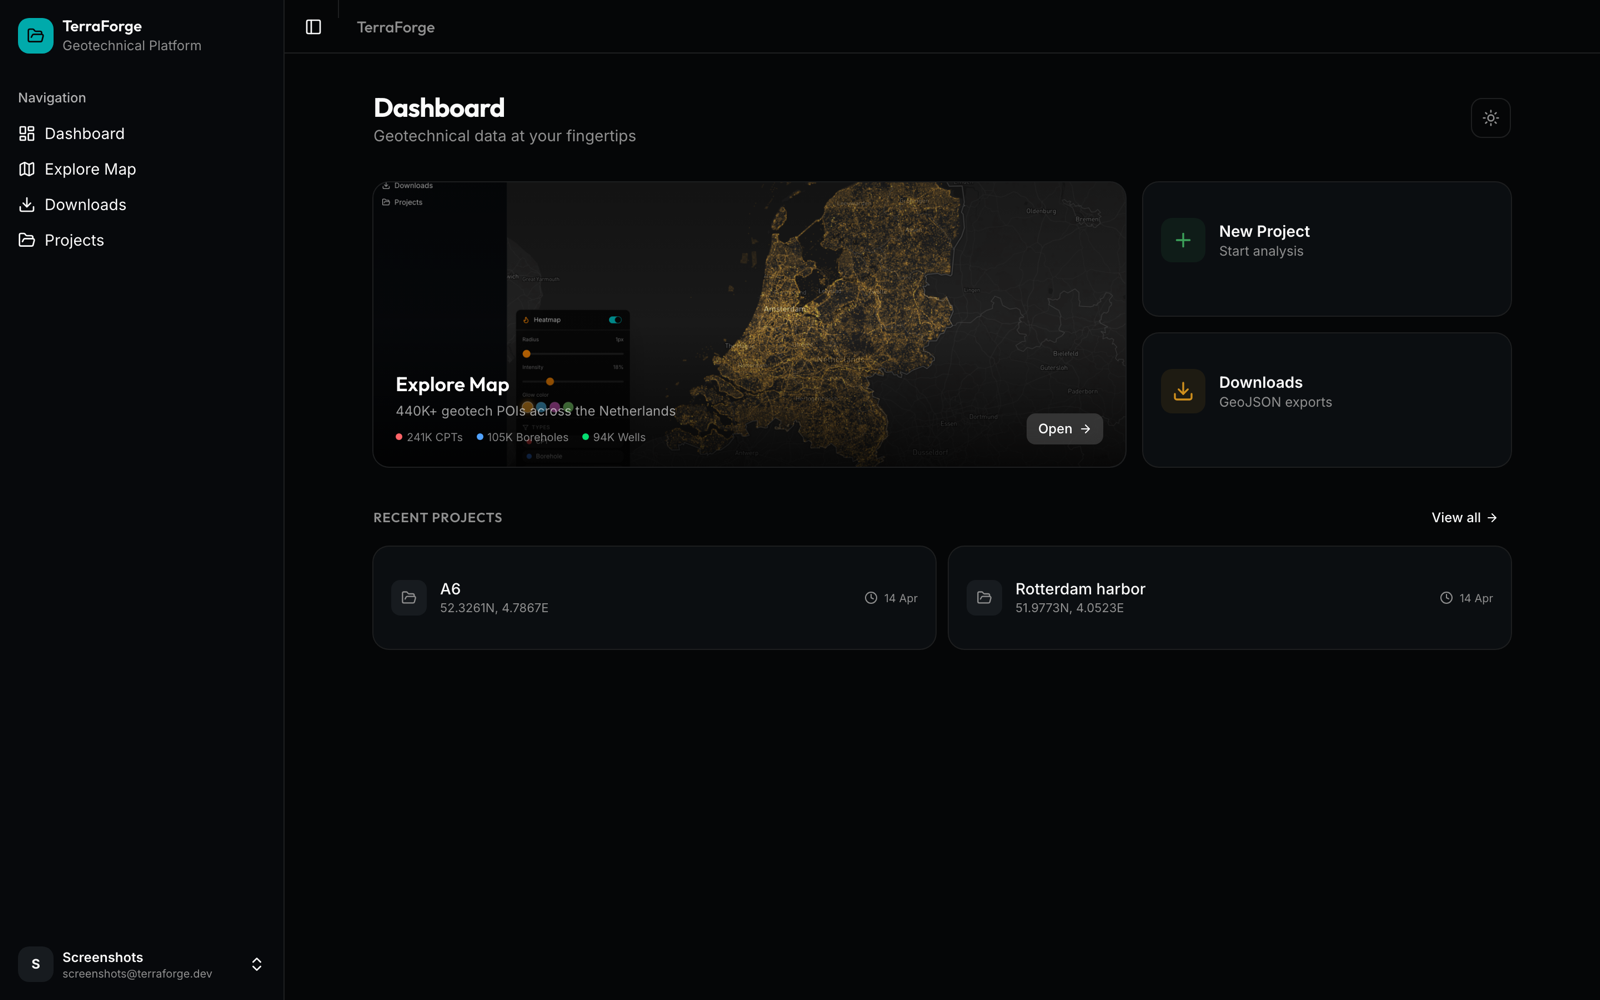
An open map of 440,000 geotechnical investigation points across the Netherlands — plus a proof that heavy engineering calculations can run entirely in the browser, in Rust, compiled to WebAssembly.
Rust + WASMMap-firstOpen dataLive
Note: this page is an AI-generated summary of the project. The product, the code, and the data behind it are real — the prose isn't hand-written.
// why
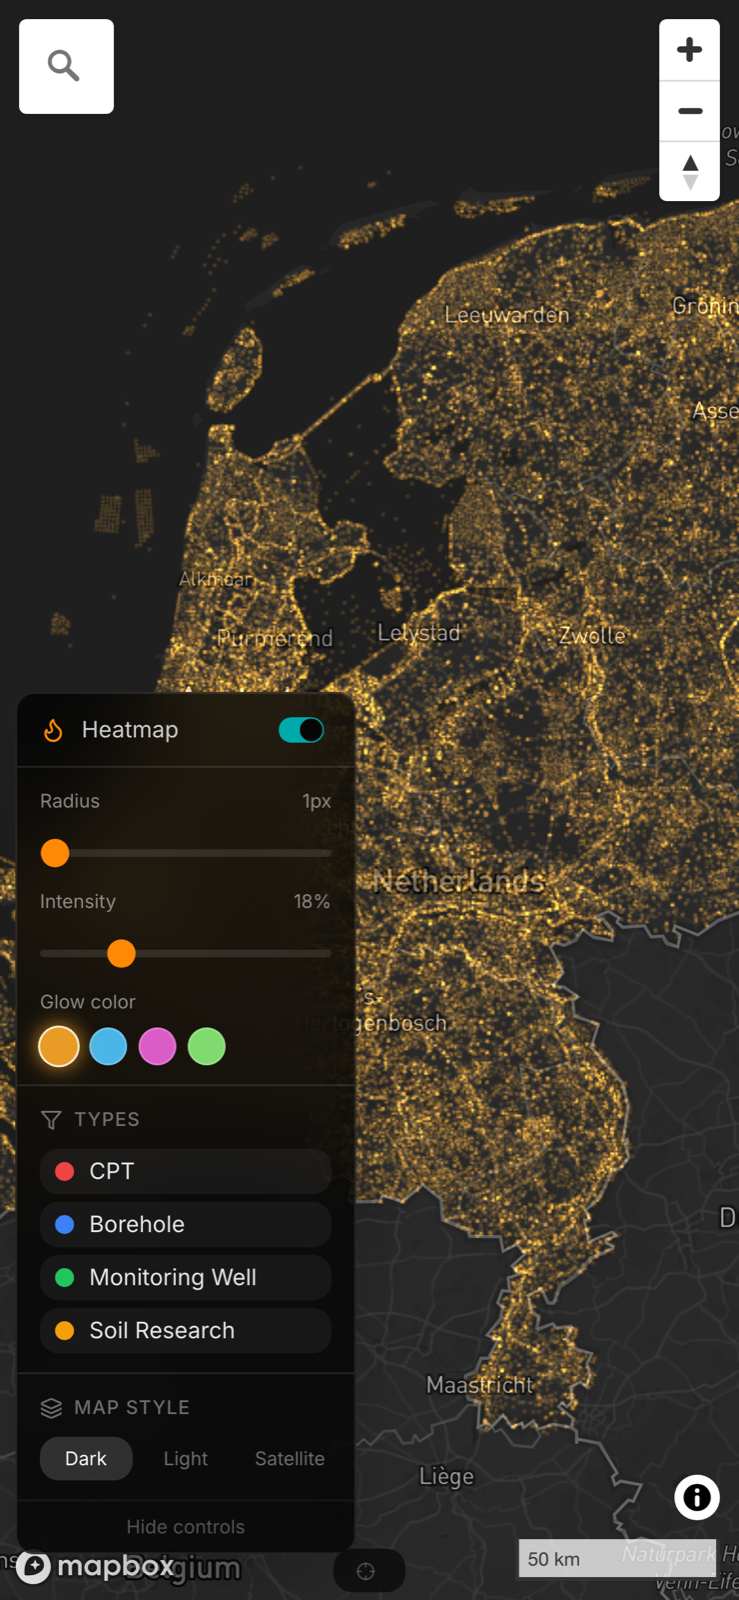
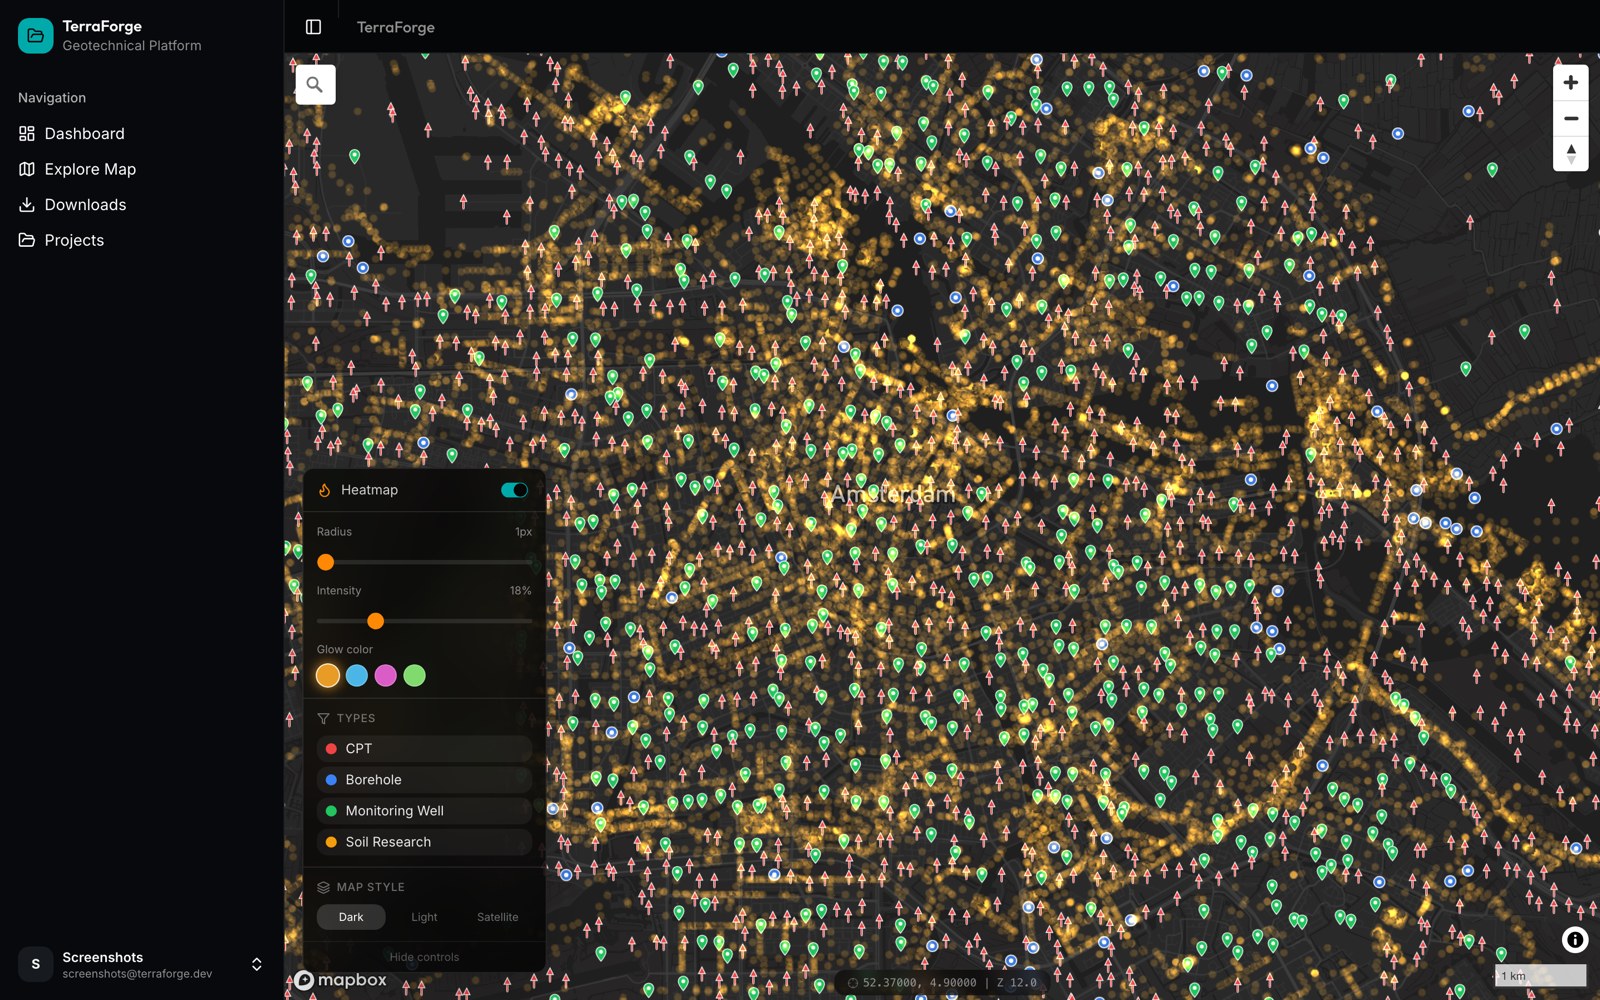
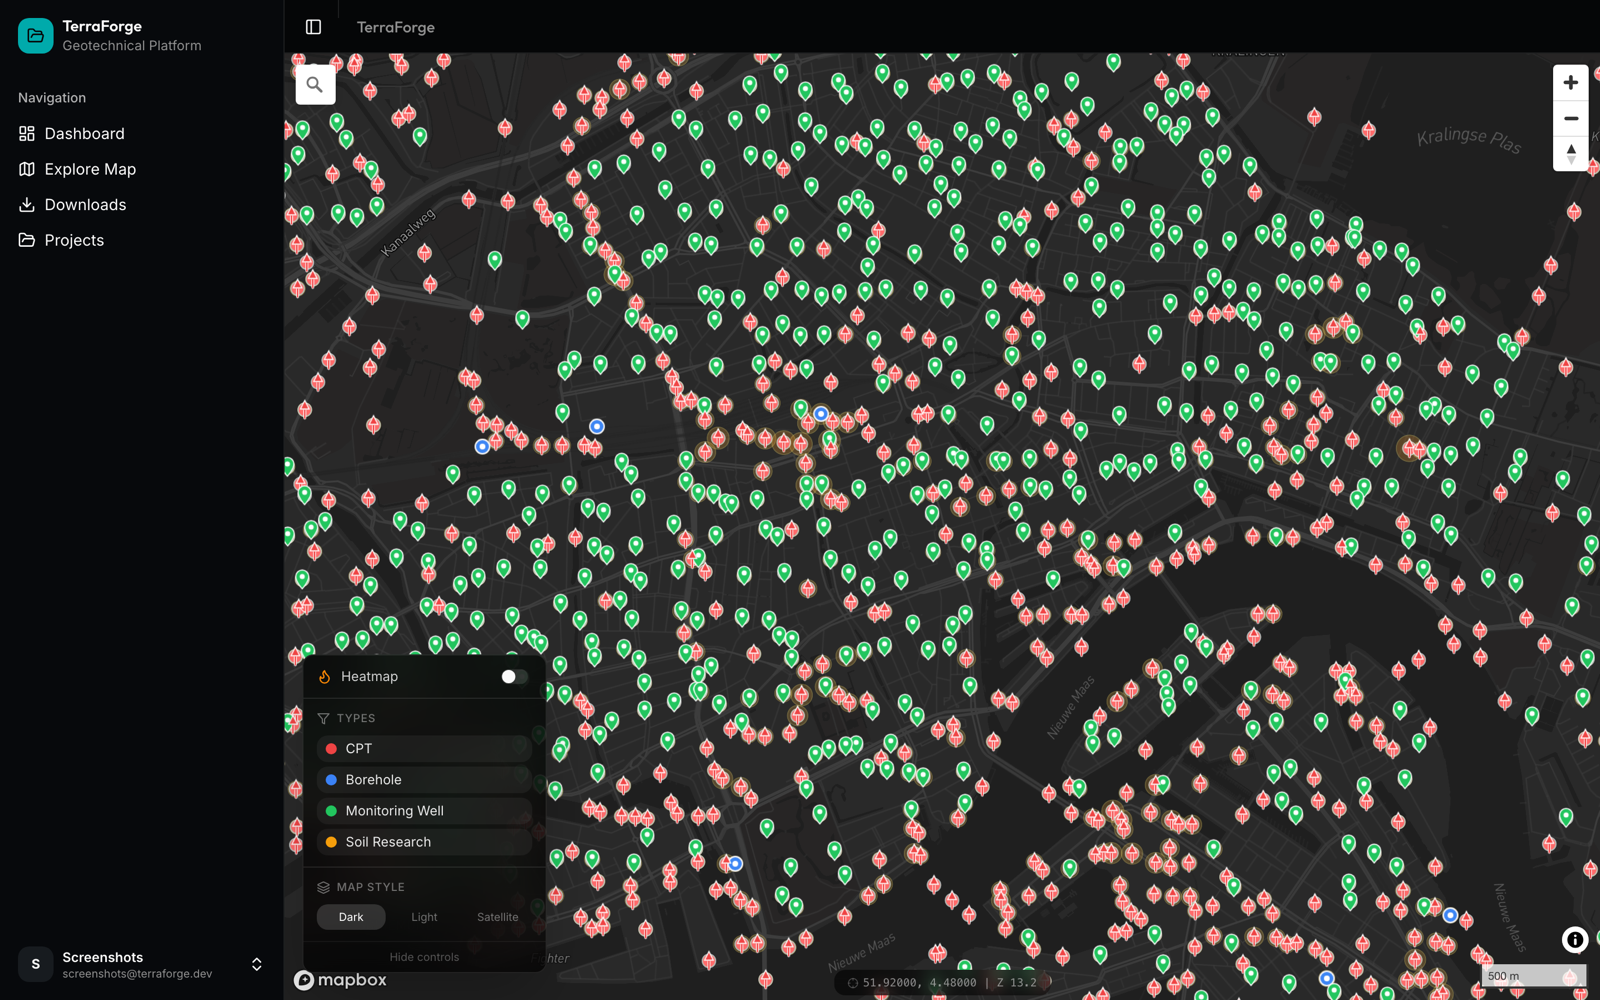
// look
// the WASM bit
// stack
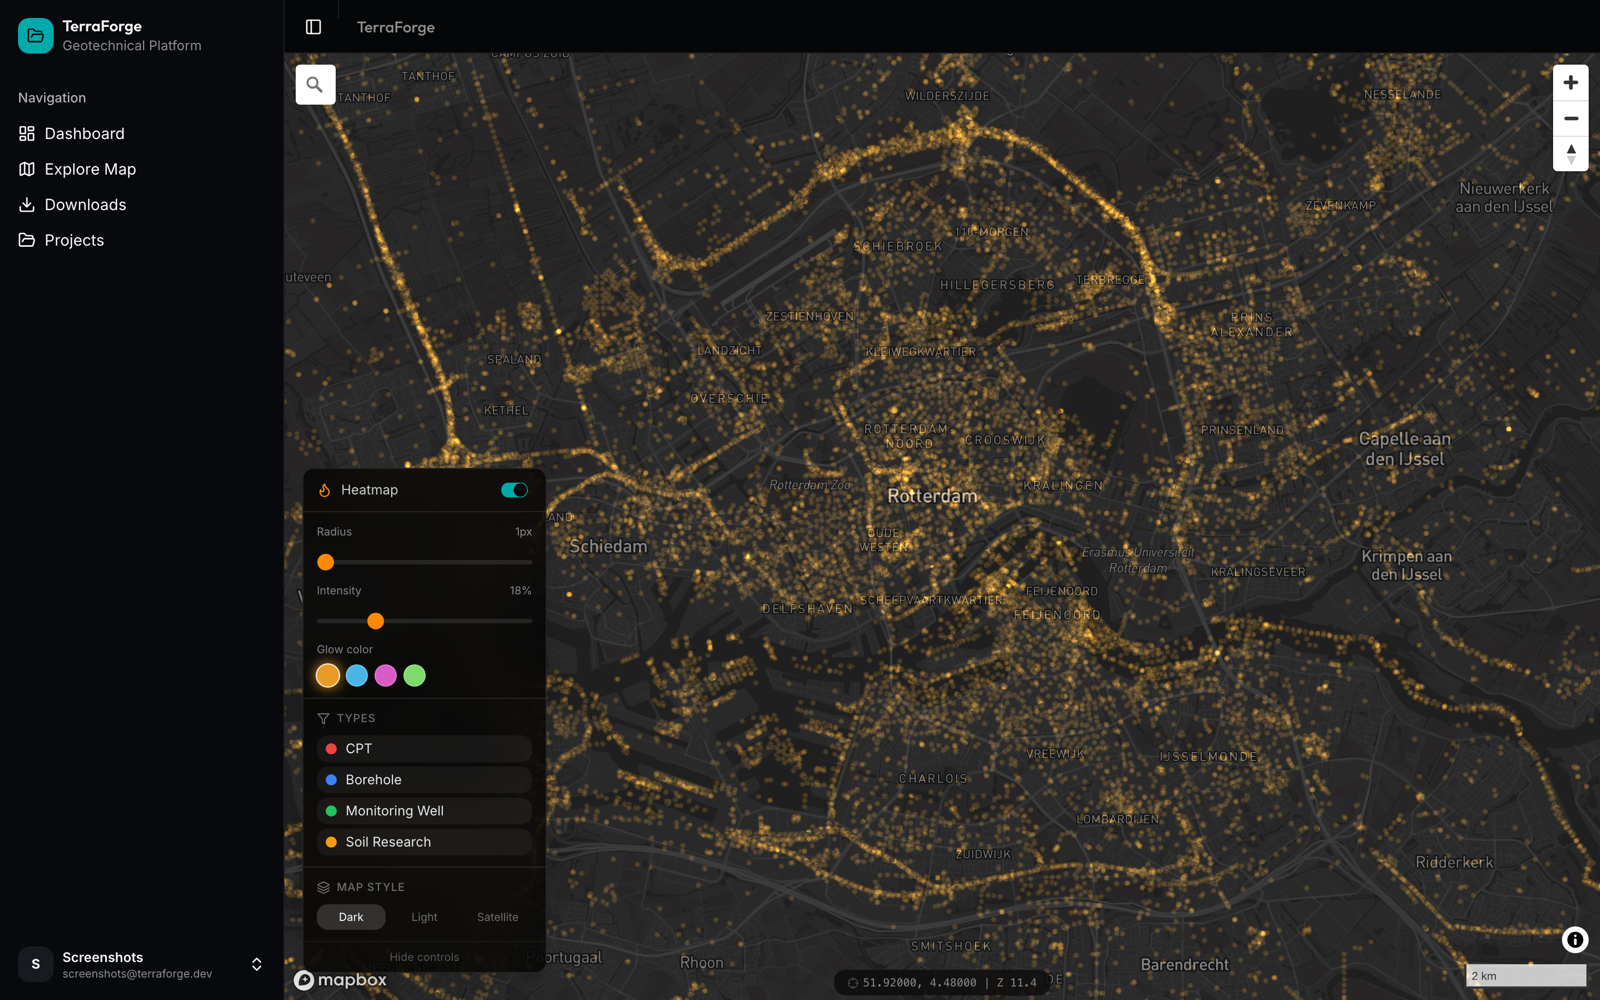
The map ships 440,000 points as a 20 MB PMTiles archive, complemented by a JSON blob of raw coordinates for the deck.gl glow layer. Authentication gates the app but tile requests carry a JWT, so the heatmap itself is the product demo.
// status
// work together